Urban Heat Vulnerability in Athens-Clarke County
Not every neighborhood feels the same summer. A GIS analysis of where heat concentrates in Athens, and who lives with the consequences.
The question
Cities don't heat up evenly. Asphalt, roof material, and the absence or presence of tree canopy can mean a ten-degree difference between neighborhoods on the same August afternoon. The urban heat island effect has been documented for decades, but its distribution inside a single city tracks closely with income, housing age, and historical disinvestment.
This project asked a straightforward question about Athens-Clarke County: where is the heat burden concentrated, and does it fall on the people least equipped to respond to it?
Method
The analysis combined three layers:
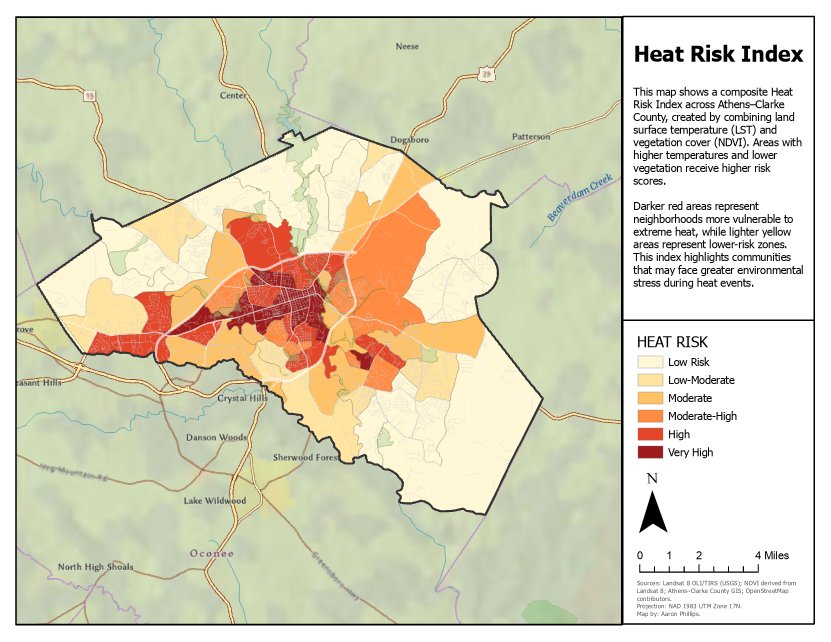
- Land surface temperature derived from Landsat thermal imagery during peak summer heat
- Tree canopy coverage pulled from the National Land Cover Database
- Socioeconomic indicators at the census tract level, including median household income, housing vacancy, and racial composition
Tracts were ranked by a composite heat risk score that weighted temperature, canopy loss, and social vulnerability. The output is a choropleth map of Athens-Clarke County showing heat risk from low to severe.
What the data showed
The geography of heat in Athens does not distribute randomly. The hottest tracts cluster in areas with the lowest median income, the least tree canopy, and the highest percentages of rental housing. The coolest tracts sit in neighborhoods with larger lots, mature canopy, and higher home values.
This pattern is consistent with what the environmental justice literature has documented in cities across the United States: heat burden is not weather, it is infrastructure, and infrastructure reflects decades of uneven investment.
Why it matters
Heat kills more Americans than any other weather hazard. As summers get longer and hotter, the neighborhoods with the least shade and the oldest HVAC systems will bear a disproportionate share of hospitalizations and deaths. Understanding where heat concentrates in Athens is a starting point for targeted canopy restoration, cooling center placement, and utility assistance policy.
I carry this project forward as one piece of a broader interest in how cities distribute environmental burdens, and what a more equitable urban ecology might look like.